The data below includes all Berkeley Lab employees* as of September 30, 2023.
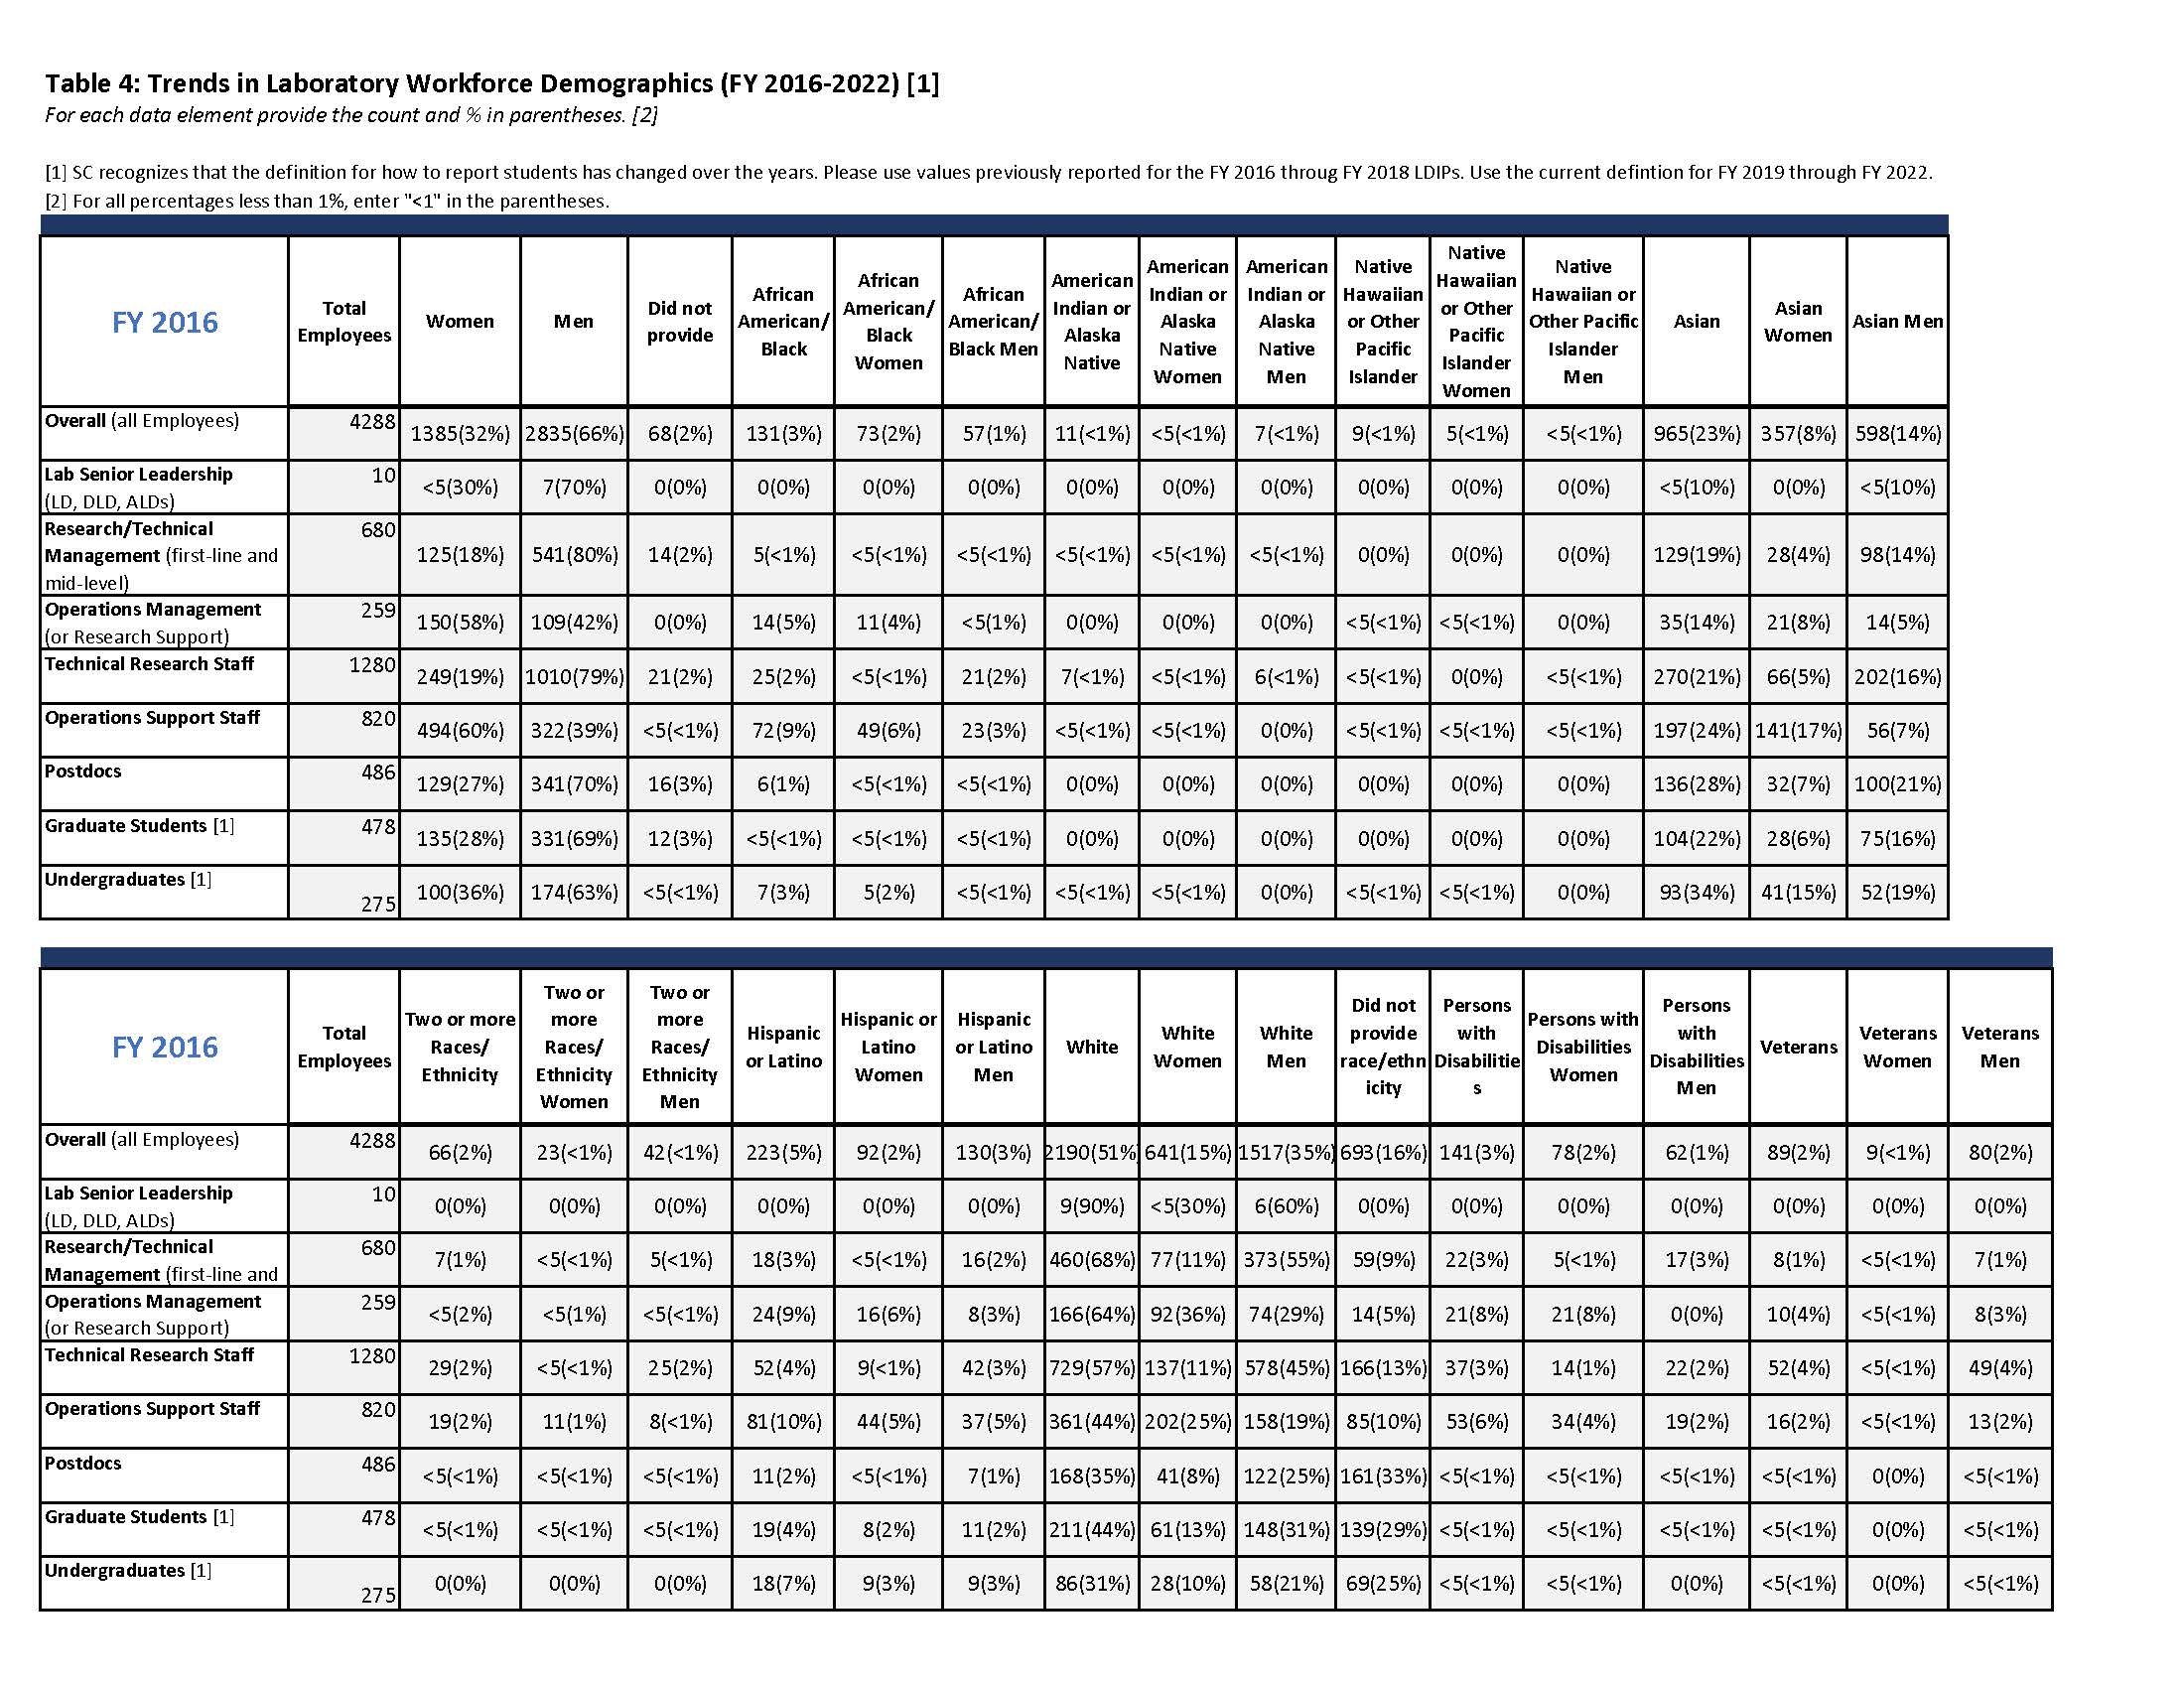
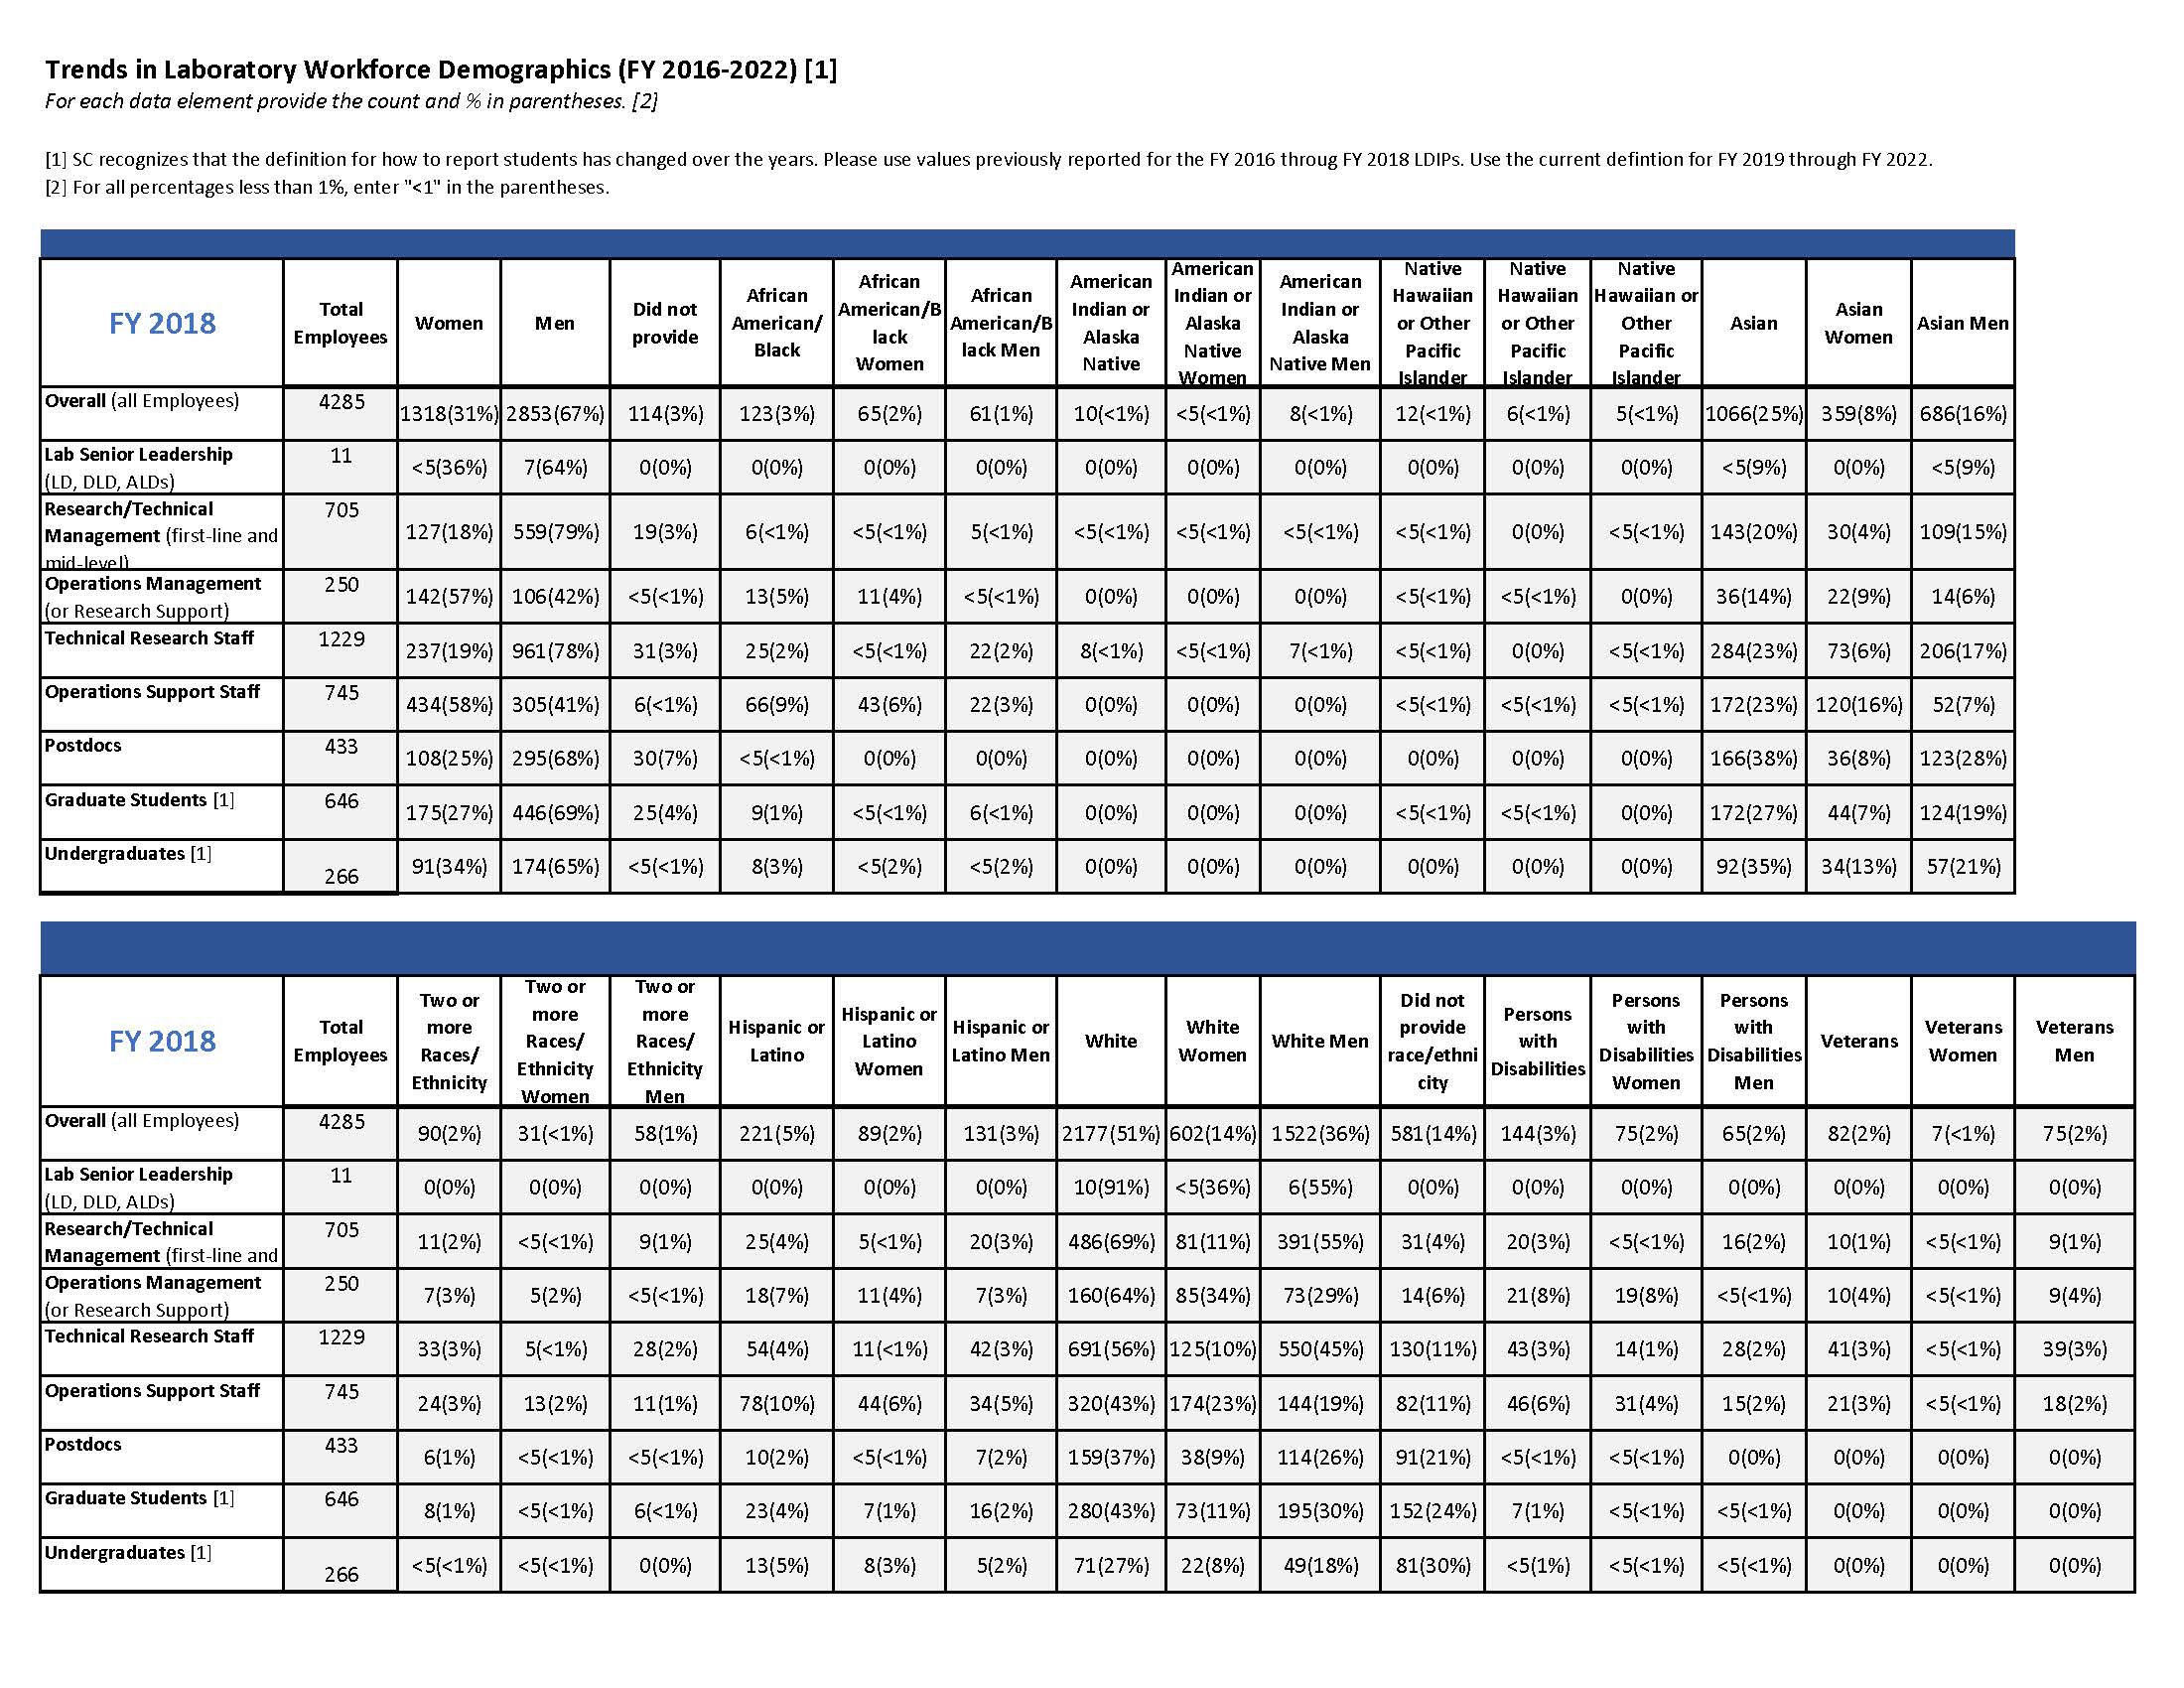
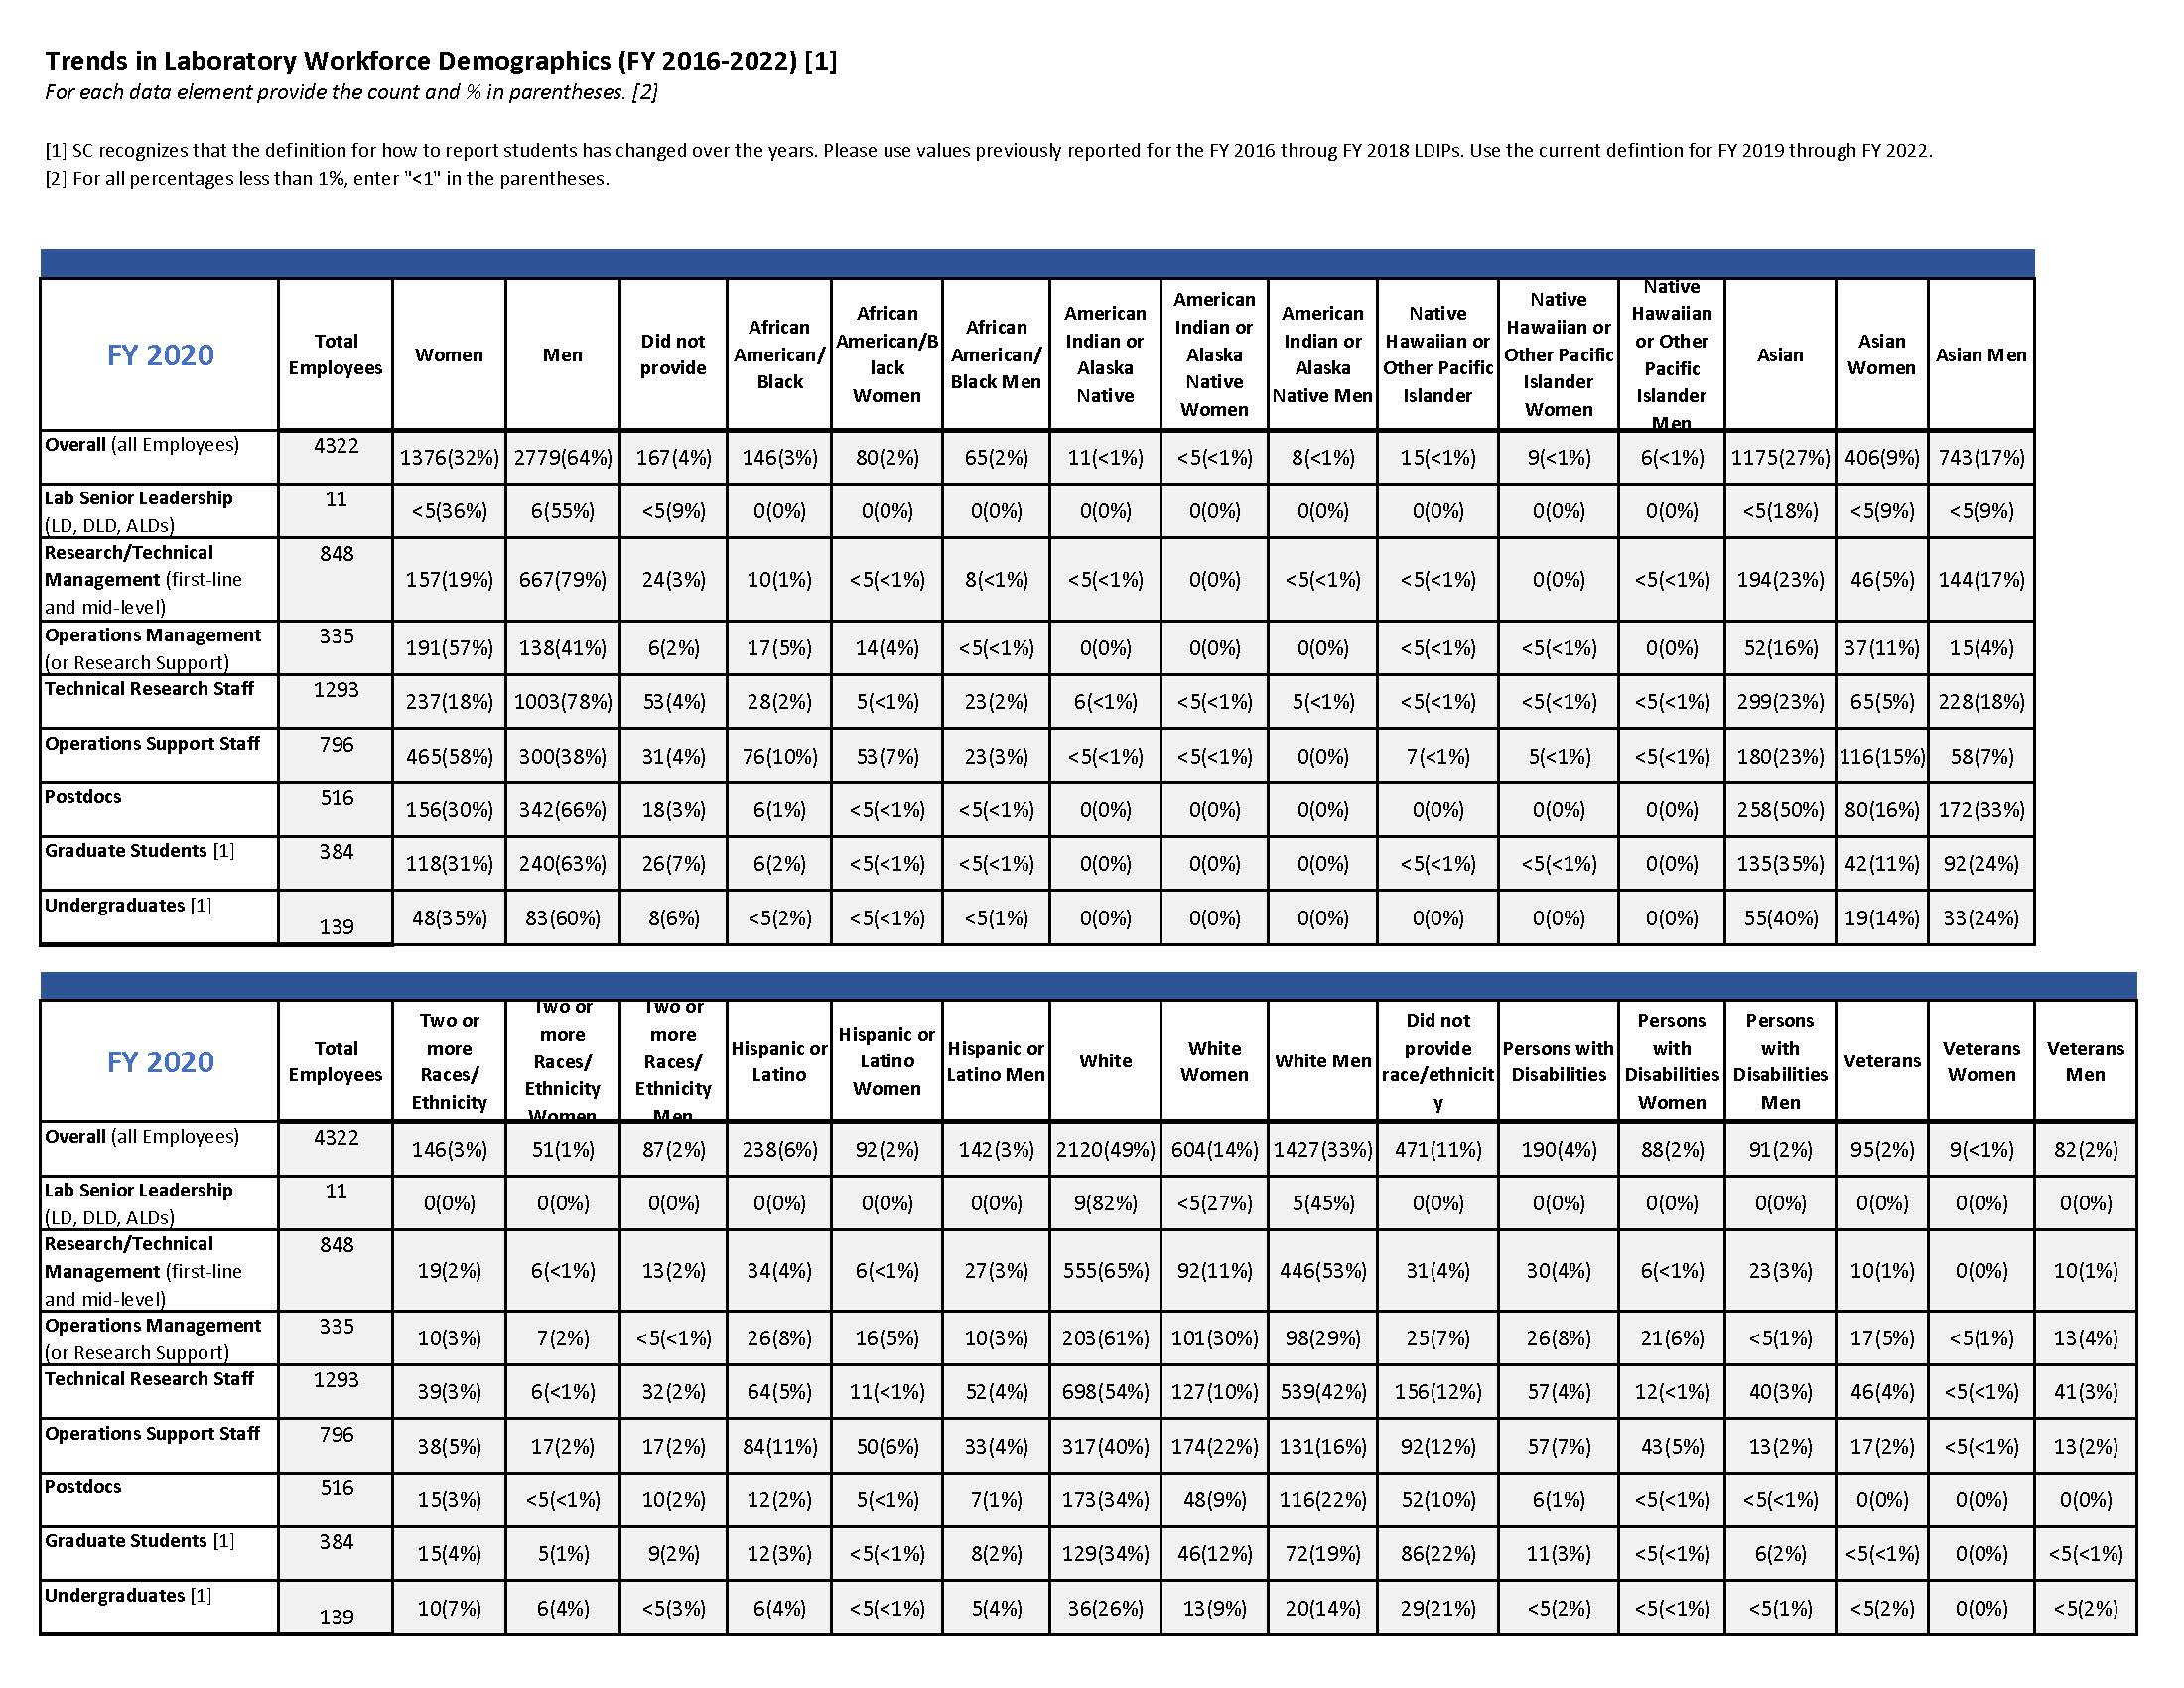
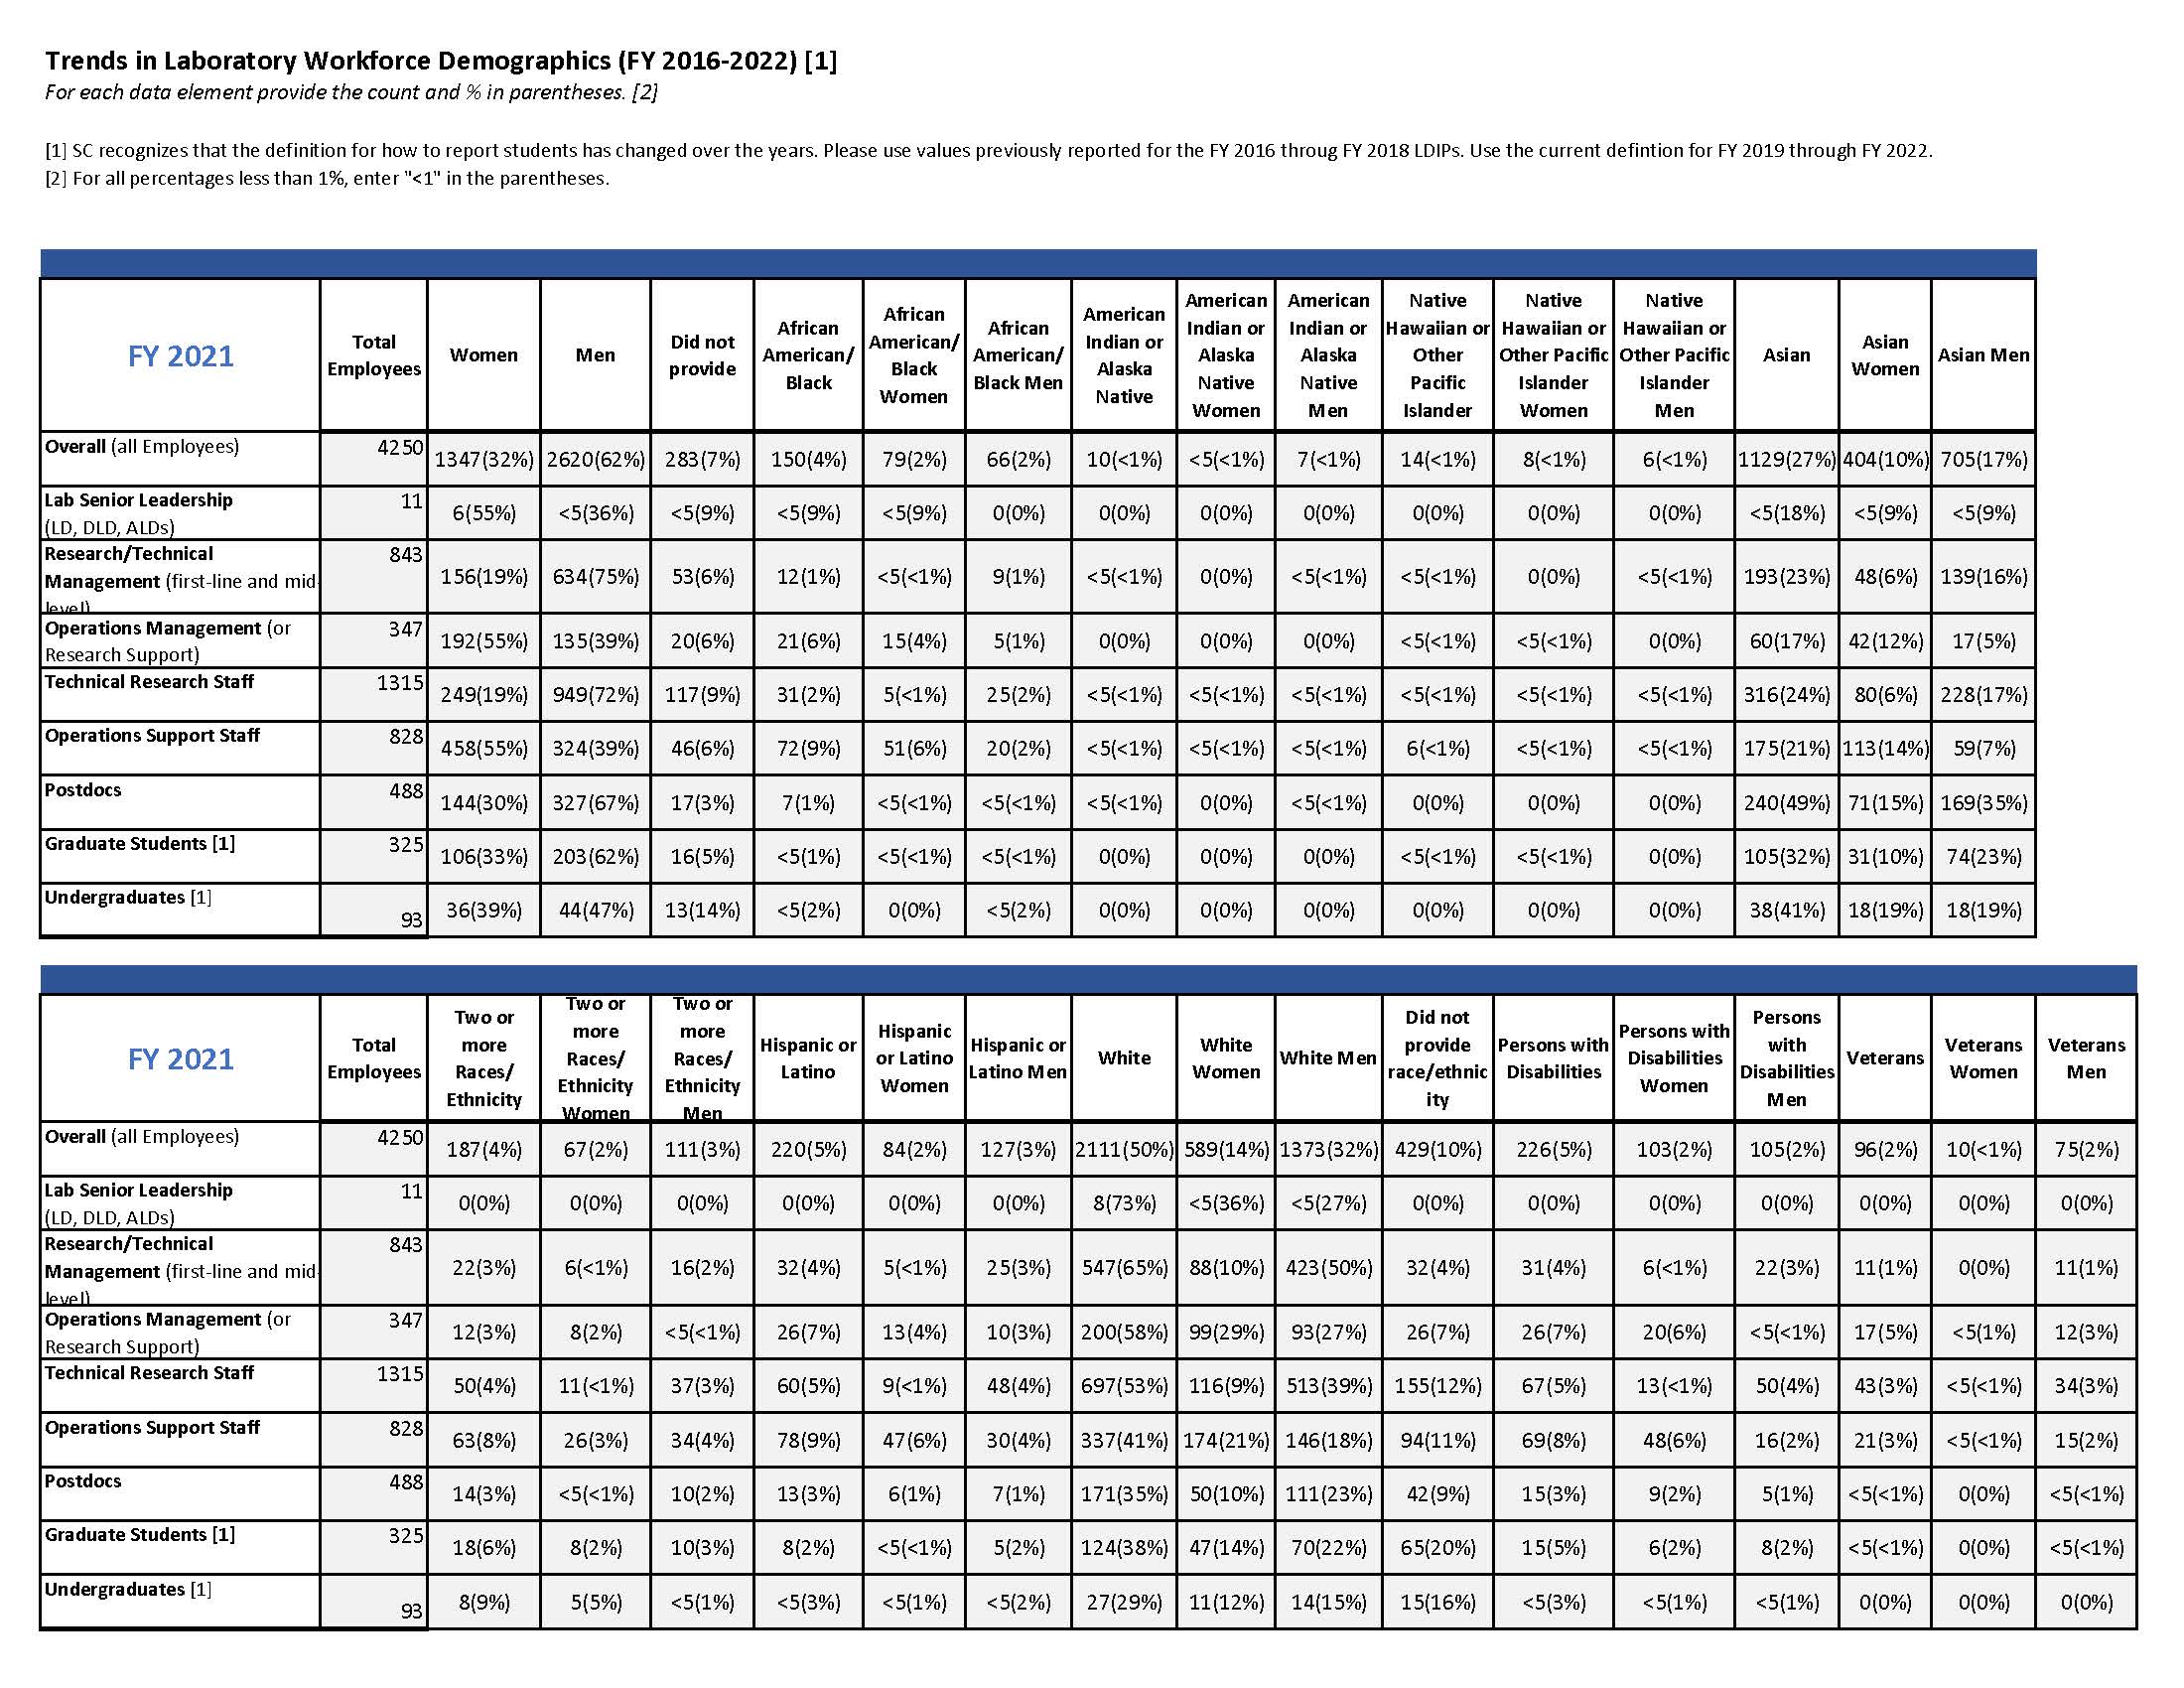
The categories here follow federal reporting requirements. These categories are not disaggregated in a way that expresses the full range of employee identities (such as non-binary gender or other gender minority identities). It also may aggregate people with diverse backgrounds and experiences into one category (such as Black combined with African-American, or Native Hawaiian combined with Pacific Islander). Our goal is to conduct additional demographic analyses in the near future.
Percentages of individual groups will not add up to 100 percent due to some employees choosing not to provide us with their demographic data.
More Berkeley Lab Worksforce Demographics can now be found on the FAIR Office website: Click here to view the Lab’s 5-Year Workforce Demographic Dashboard. The dashboard includes data from July 1, 2017-2021.
Workforce demographic data for all the national labs can be found here.
* Employee classes: Career, term, limited, Joint and Shared Faculty, rehired retiree, postdoctoral fellow, graduate student, and student assistant.
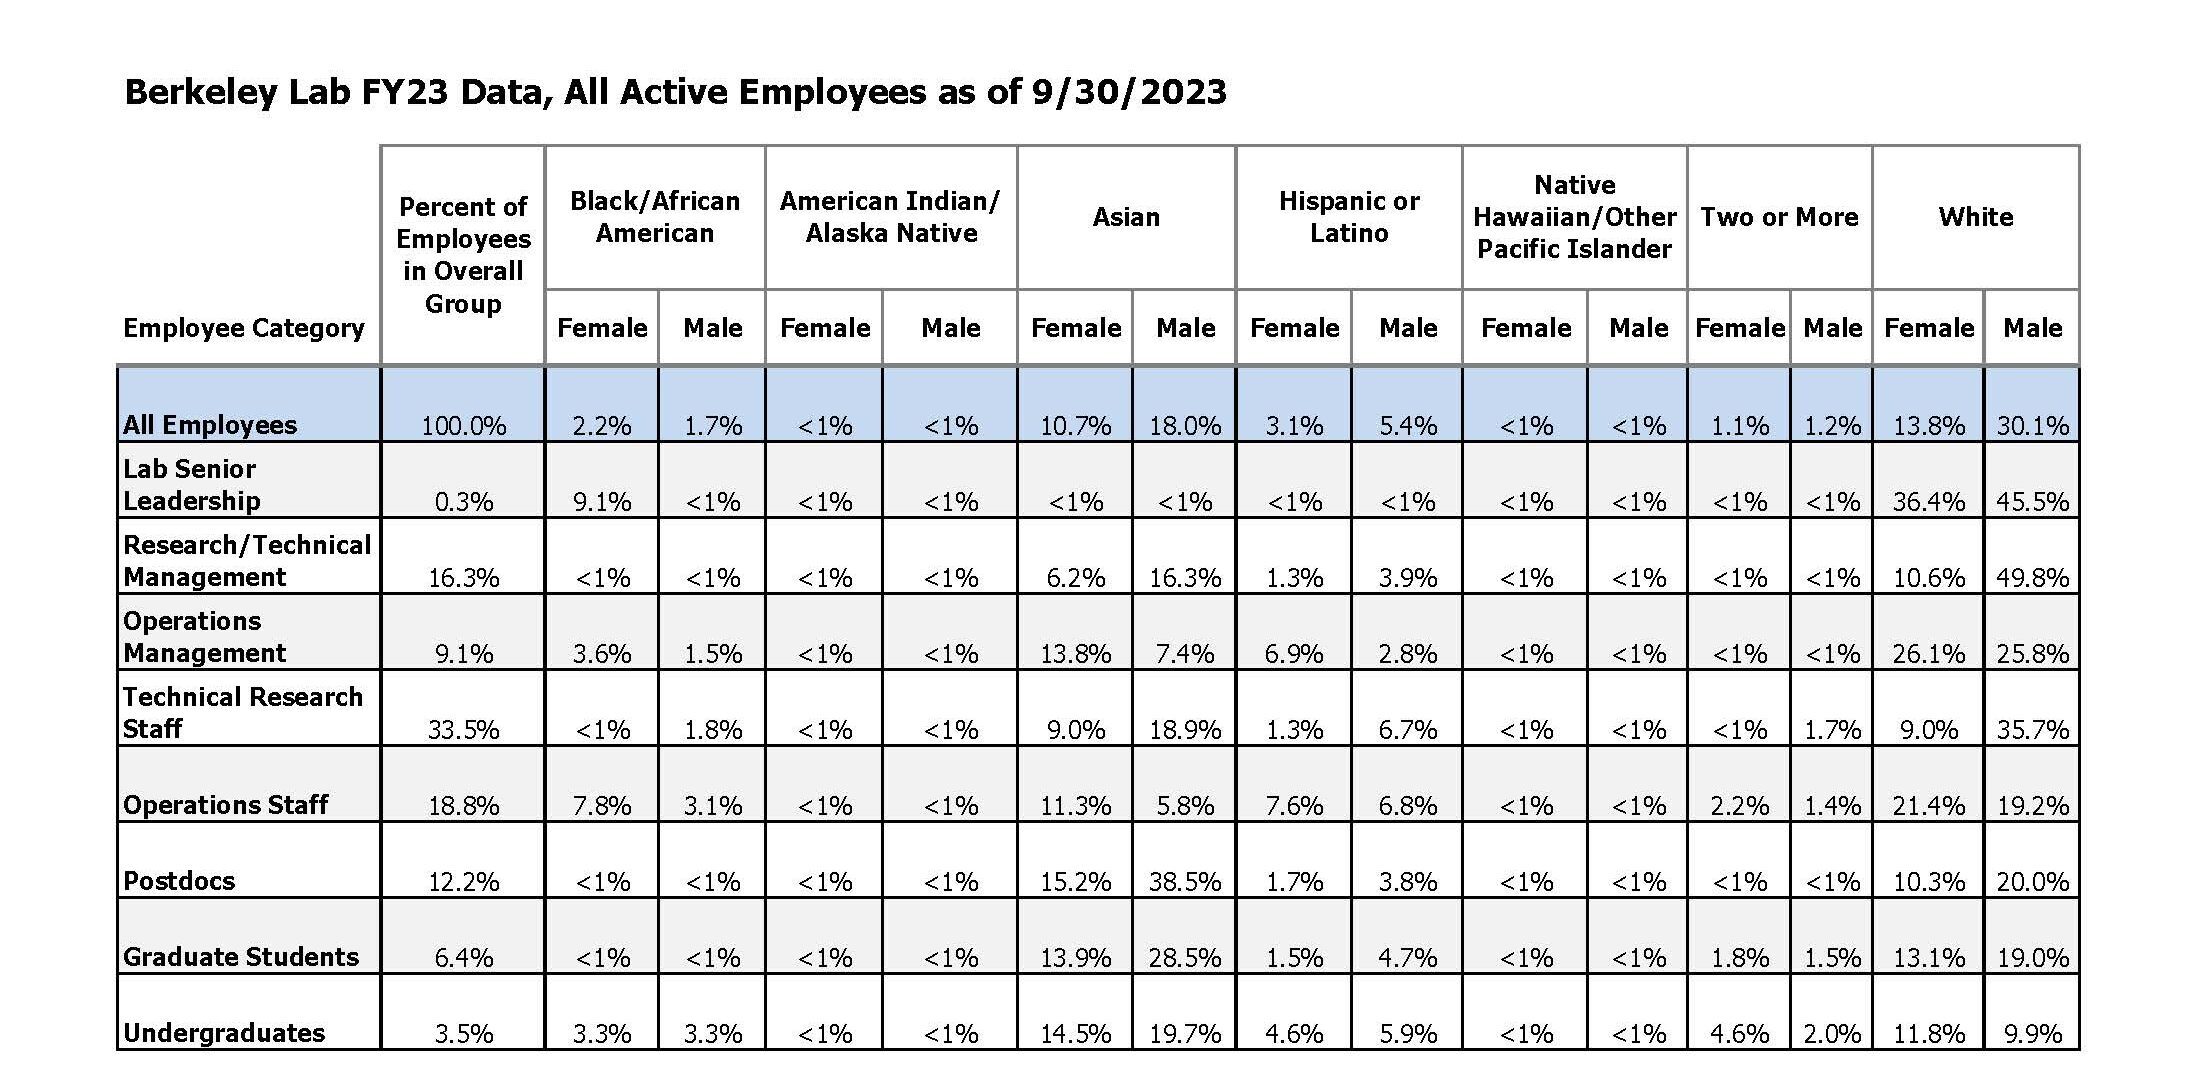
Employees identifying themselves with two or more racial categories that are not Hispanic/Latino, are counted in the “Two or More” category. Employees that identified themselves as Hispanic/Latino and any other race(s) are counted in the “Hispanic or Latino category.
Trends in Laboratory Workforce Demographics (FY 2016-2022)